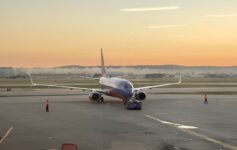
In a summer of terrible travel experiences across the United States, some airports are struggling more than others. Here are the worst airports in the US.
If you are considering booking travel or signing up for a new credit card please click here. Both support LiveAndLetsFly.com.
If you haven’t followed us on Facebook or Instagram, add us today.
It’s Been A Tough Summer
Flight delays have plagued airports in the country all summer long due to record demand, fewer seats, and the pilot shortage. Business travelers have returned in smaller numbers to the sky making the already limited availability and pent-up demand worse. Delays and cancellations have abounded and reports have flooded every news outlet.
If you’ve flown in this misery, my condolensces. Our agents have been inundated by clients braving the biggest airports in the world with few alternatives when things go wrong. One tool that has been helpful to our team is Flight Aware because it does a great job of detailing reasons for a delay and helps us see problems before they become our client’s problems.
The Worst Airports In The US
As you might have suspected, some of the busiest airports in the United States are also those struggling with completing on-time flights, however, there were some surprises on this list too. Flight aware published this list based on tracking data. Here are the worst airports in the US and the percentage of flights cancelled between May 28th-July 13th.
- Newark Liberty International Airport: 7.9%
- LaGuardia Airport: 7.4% (New York City)
- Reagan National Airport: 5.4% (Washington DC)
- Raleigh-Durham International Airport: 4.3%
- Cleveland Hopkins International Airport: 3.7%
- Pittsburgh International Airport: 3.7%
- Philadelphia International Airport: 3.6%
- Boston Logan International Airport: 3.6%
- John F. Kennedy International Airport: 3.5% (New York City)
- Charlotte Douglas International Airport: 3.4%
Here’s the worst airports in the US for delays with percentage of flights delayed:
- Chicago Midway International Airport: 36%
- Orlando International Airport: 33%
- John F. Kennedy International Airport: 31.1% (New York City)
- Newark Liberty International Airport: 30%
- Baltimore Washington International Thurgood Marshall Airport: 30%
- Miami International Airport: 28.3%
- Charlotte Douglas International Airport: 27.8%
- Fort Lauderdale-Hollywood International Airport: 27.2%
- Denver International Airport: 27.2%
- Harry Reid International Airport: 26.7% (Las Vegas)
While most of these are large airports, Pittsburgh (my home airport) and Cleveland are notable exceptions. That said, Los Angeles, San Francisco, and Seattle don’t make the list in the west and surprisingly, Atlanta Hartsfield-Jackson International is also off the list. In fact, Delta hubs are missing almost entirely, as Minneapolis, Detroit, Atlanta, and Salt Lake City do not make either list.
Delays Worse Than Cancellations
Southwest is having a miserable time as many of its hubs rank either for delays or cancellations. Ignoring Orlando and Las Vegas (because many carriers frequent those) and just focusing on airports where Southwest is the dominant carrier, it’s been ugly. Chicago Midway is delaying more than a third of flights, and Baltimore is at nearly the same.
For origin and destination airports, the issue is worse for travelers. On Friday, July 15th, 2022 more than 2.42 million passengers passed through a TSA checkpoint but when flights are delayed, that doesn’t mean the passenger arrived at their destination later, some may cancel, drive or in the case of the Northeast – take a train. Those at their origin can go home and while it may be inconvenient, they are not put in nearly the same position as a traveler who is delayed to the point that their connection and onward travel is unviable away from home. Those folks have checked out of hotels, returned their rental cars, and may not have any more clean clothes but may be forced to overnight some place close to the airport with few food options at sky-high rates.
Wait times to get a flight disruption corrected are at an unreasonably long time whether in person or on the phone.
When a flight is cancelled, more options become available, but when a flight is merely delayed, the airline is permitted to kick the can down the road for a nearly interminable amount of time. One client traveling two weeks ago had an American Airlines flight at the gate but was delayed “due to weather”, we moved them to a direct on another carrier who took off on-time from the same airport facing the same weather conditions. Ultimately, that client’s flight was delayed from afternoon to evening to the next morning before ultimately cancelling. It must have been a single gate-sized hurricane.
Conclusion
Airports serving the northeastern United States have always faced challenges of high traffic, congestion, and short flight times which can cause aircraft to pile up. But this summer, it’s everywhere but the west coast.
What do you think? Have you been affected by delays and cancellations this summer?


Lots of UA and AA hubs on that list.
DL has had a couple of weekends in early June when they pooped the bed but they have mostly figured out the cancellations since late June (including the 4th holiday wknd)
I would assume weather hasn’t been as bad as historically but not seeing DFW on either of these lists is amazing. As someone who flys through it monthly or more, I’ve been lucky.
Local Metroplex resident here. As brutal as summer in DFW has been temperature wise this year, there hasn’t been any rain (as in literally, not a single drop) in over a month. Thus the usual summer pop-up thunderstorms that snarl the airport haven’t been an issue. Ironically, the summer from h*ll we’re enduring is the one thing preventing AA from going into full-on collapse, since DFW has been able to remain functional even with problems at their other hubs.
Aren’t these numbers skewed by simply using percentages? For example, if CLT has 600+ flights per day and the cancellation rate is 3.4%, that’s 20 flights per day. If PIT has 60 flights per day and a cancellation rate of 3.7%, that’s 2 flights per day!